Global Footprint Network update
Humanity’s demand on the planet is more than 50 percent larger than what nature can renew, according to Global Footprint Network’s latest data, published in the 2014 edition of the Living Planet Report. The biennial report, produced by WWF in collaboration with Global Footprint Network and the Zoological Society of London, was launched today in Geneva, Switzerland.
Released just over a week after the UN Climate Summit in New York City and massive marches around the world, the report shows that for the past 40 years, humanity’s demand on nature has exceeded what our planet can replenish. During the same period, vertebrate wildlife populations have declined on average by more than half, as measured by the Living Planet Index.
"It is no coincidence that our Ecological Footprint has climbed while biodiversity has plummeted. Overshoot is a core pressure on biodiversity, and WWF is the leading conservation organization recognizing and addressing this link," said Mathis Wackernagel, President and Co-founder of Global Footprint Network. "Living within the budget of nature is not just beneficial for our own welfare and resilience but also for the well-being of countless other species on our planet."
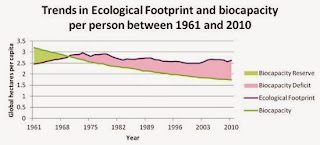
According to Global Footprint Network’s calculations, it would take 1.5 Earths to renew all the ecological services humanity demands: food and fiber production, accommodation of built structures as well as the sequestration of CO2 from fossil fuel burning. In other words, it now takes more than a year and six months for Earth to replenish what humanity demands in one year. Global overshoot is possible because we can cut timber more quickly than trees regrow, pump freshwater faster than groundwater restocks, and release CO2 faster than nature can sequester it.
While humanity’s cropland and fishing Footprints have increased, carbon has been the dominant component of humanity’s Ecological Footprint for more than half a century. And for most years, it has been on an upward trend. Carbon accounted for more than half the global Ecological Footprint, at 53 percent, in 2010, the latest year the most complete dataset is available. Land used for food production is another major factor in humanity's increasing Footprint.
Comparing the Ecological Footprint of Countries
Examining the Ecological Footprint at the per-person level shows that people living in different countries vary greatly in their demand on Earth's ecosystems. For example, if everyone in the world lived like the average resident of Kuwait, which presently has the world's highest per capita Footprint, we would need the equivalent of 6 planets to regenerate our resources and absorb the CO2 emissions. If everyone lived like a resident of the United States, we would need the resources of 4 planets.
Countries with the largest Ecological Footprints per person include: Kuwait, Qatar, Denmark, Belgium, United Arab Emirates, Singapore, United States of America, Bahrain and Sweden. Conversely, Haiti, Eritrea, and Timor-Leste are among the countries with the smallest Ecological Footprints, under 0.6 global hectares (1½ acres) and, in most cases, too small to meet basic requirements for food, shelter, infrastructure and sanitation. These countries may well need to increase their access to resources if they are to bring large segments of the population out of poverty.
You can check out your country’s data on our website at www.footprintnetwork.org/nations by choosing your country from the dropdown menu.
Who has the greatest natural capital?
Analysis of biocapacity also reveals vast differences between countries. About 60 percent of the world’s biocapacity is found within the borders of just 10 countries: Brazil, China, the United States, Russia, India, Canada, Australia, Indonesia, Argentina and Congo.
But a biocapacity-wealthy nation does not necessarily have a biocapacity “reserve.” Even in nations with high biocapacity, local, national and international demand can exceed availability. Indeed, despite technological advances, agricultural inputs and irrigation that have boosted the average yields per hectare of productive area, especially for cropland, biocapacity per capita has fallen from 3.2 in 1961 to 1.7 global hectares in 2010 globally. The main driver has been population growth.
"Particularly for low-income communities, it is imperative to have access to ecological assets, since those communities are at a significant economic disadvantage to compete for more resources on the world market," said Wackernagel. "Resource access is therefore a key factor to enable lasting development."
What can you do?
Please help spread the word about the findings in the Living Planet Report through your social media network by sharing our Facebook and Twitter posts with the hashtag #LPR2014.
You can calculate your own personal Ecological Footprint and explore how to lower it with our online calculator at www.footprintnetwork.org/calculator. Also, support our efforts to make the calculator available to millions more people around the world through a mobile app. Stay tuned for more details in October, when we launch a crowdfunding campaign to raise money for the calculator mobile app.
Thank you for supporting Global Footprint Network!
Download the Living Planet Report 2014: www.footprintnetwork.org/lpr2014
Download the Living Planet Report 2014 Summary: www.footprintnetwork.org/lpr2014sum


Comments
Post a Comment